
Application Insight
Advanced application monitoring based on OpenTelemetry, the open standard for metrics, logs and traces.
Application performance, in detail
Application Insight is the Sentinet³ Application Monitoring module. Based on OpenTelemetry, it offers a clear and detailed view of application performance and identifies bottlenecks, errors and anomalies in real time.
It is the AppOps module of the Infinity ecosystem: it oversees the entire flow of application requests, promptly detects errors and slowdowns and, through the Infinity Correlation Engine, relates its data to that of the other modules.
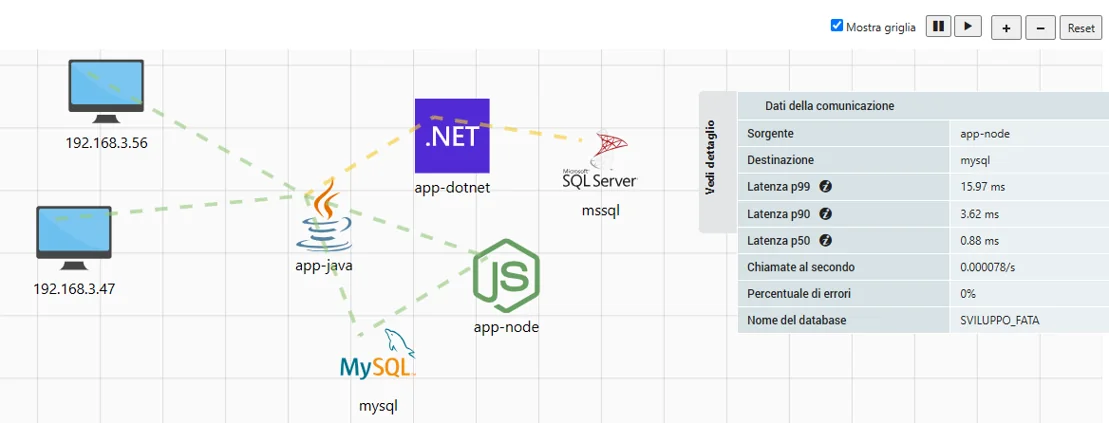
Reliable, fast and scalable applications
Business applications must deliver reliability, speed and scalability. Application Insight helps maintain the highest performance standards.
Problems spotted early
Continuous application monitoring to spot problems before they affect users.
Less latency, better code
Detailed performance analysis to reduce latency and optimise code.
Errors and anomalies in real time
Automatic detection of errors and anomalies, with real-time alerts.
Correlated metrics and logs
Correlation between metrics and logs for faster problem resolution.
Any stack, with OpenTelemetry
Adaptable to any technology stack thanks to OpenTelemetry, the open standard for metrics, logs and traces.
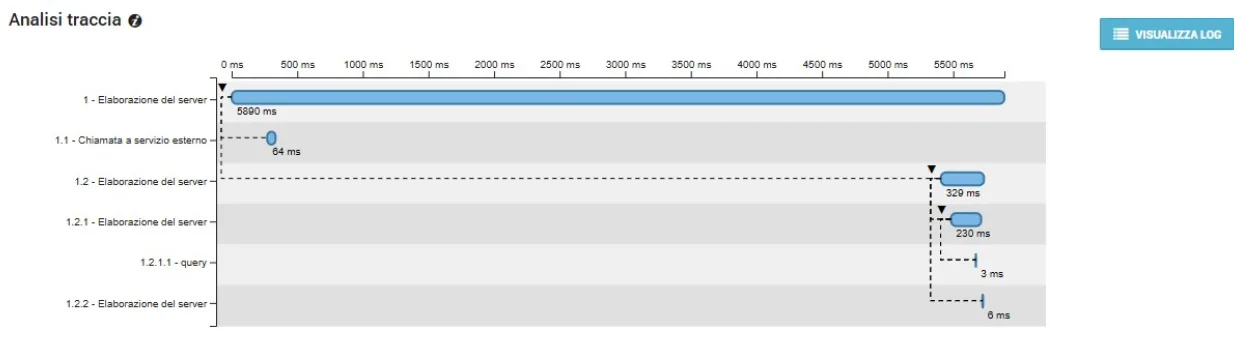
One request, call by call
Application Insight displays the entire application execution chain: the trace timeline breaks a request down into the calls that make it up and shows where the time is spent.
This makes it possible to identify slow response times and the most critical requests, even in microservice, container and cloud-native architectures.
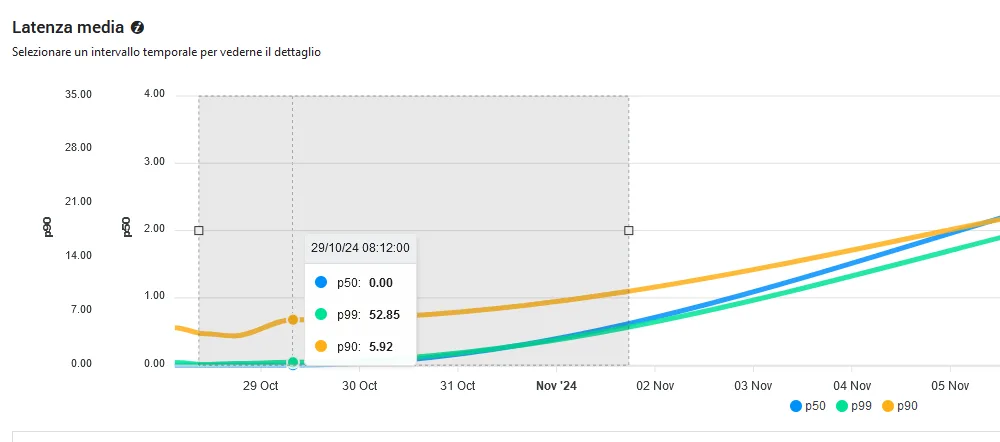
Latency over time
The trend of average latency reveals slowdowns and anomalous changes in load. Read together with errors and system metrics, it leads more quickly to the cause of the problem and shows where to optimise the code.
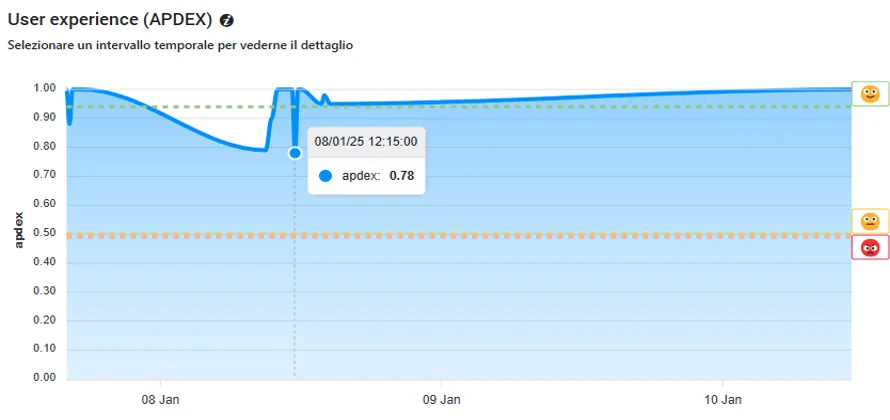
The user experience
The module includes the End User Experience and Business Monitoring capabilities: the quality perceived by users becomes an indicator to track over time, alongside technical metrics.
Why OpenTelemetry
Application Insight collects metrics, logs and traces through OpenTelemetry, the open standard for application telemetry. This is why it adapts to any technology stack.
Metrics, logs and traces together. Reading the three sources in the same console lets you move from the symptom (a growing latency) to the call that causes it and the logs that explain it.
What Application Insight does
Real-time monitoring
- Collection of metrics, logs and traces for a complete view of applications.
- Identification of slow response times and the most critical requests.
- Display of the entire application execution chain (distributed tracing).
Anomalies and error management
- Automatic detection of application errors and malfunctions.
- Analysis of application behaviour to detect anomalous changes in load.
- Notifications for immediate alerts on system issues.
Performance optimisation
- Analysis of resource usage to reduce waste of CPU, RAM and storage.
- Correlation between response times, errors and system metrics.
- Support for microservices, containers and cloud-native architectures.
Customisable dashboards
- Interactive graphical interface with views of metrics, logs and traces.
- Filters to segment traffic and requests by application, service or user.
- Automated reporting on performance over time.
Core application monitoring and Application Insight
Sentinet³ Core
Traditional application checks on application servers, Microsoft services and databases, HTTP checks and web transactions, correlation with CPU, memory, storage, network and application process. No distributed tracing APM tools required. Applications and services in Core
Application Insight
Advanced Application Performance Monitoring capabilities based on OpenTelemetry (metrics, logs and traces), with End User Experience and Business Monitoring.
Related topics
Want to see Sentinet³ on your infrastructure?
Tell us about your environment: sites, technologies, critical services. We will show you how Core and Infinity can work on your case.