
Threat Insight
From the list of CVEs to the action plan: which systems, along which paths, threaten the most critical assets.
Vulnerabilities, exposures and paths in a single reading
Threat Insight combines continuous Vulnerability Assessment, exposure assessment, attack path analysis and mitigation priorities. It does not stop at “which vulnerabilities exist?”: it shows which systems, along which paths, threaten the most critical assets, and which remediations deliver the greatest benefit.
- Continuous VA with a lightweight agent, SBOM and comparison with CVEs
- Priorities based on severity, exposure, reachability and asset role
- Attack paths, lateral movement and chokepoints
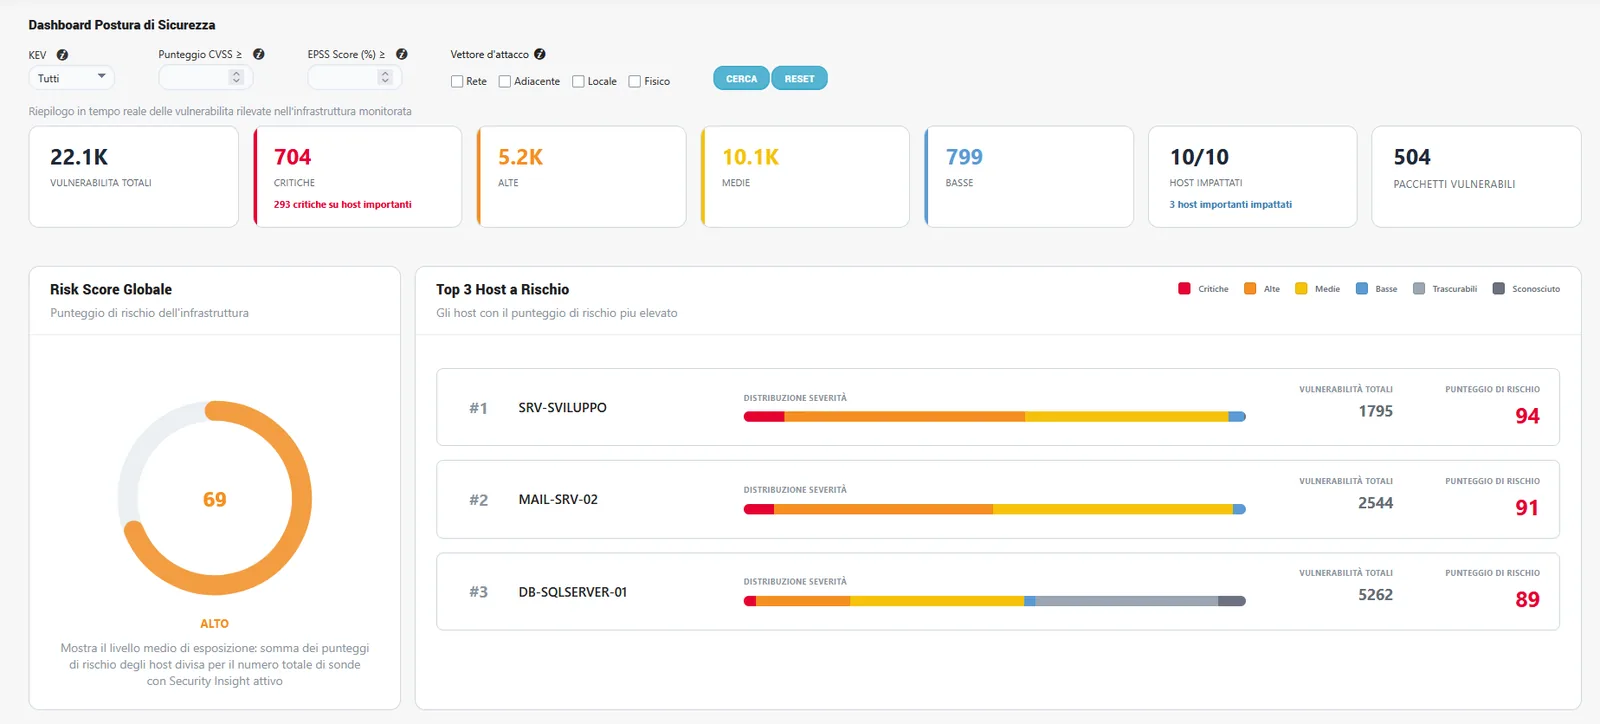
- Asset Risk Index, Path Risk Score and Global Risk Score
Effective control of the perimeter
Attacks are becoming ever more sophisticated. Threat Insight lets you:
Continuous Vulnerability Assessment
Continuously identify critical vulnerabilities in systems.
Critical entry points
Identify entry points with a dynamic ranking of the most exposed nodes, based on the actual state of the network.
Attack paths
See on interactive maps how an attacker would move from the outside in.
Lateral movement and blast radius
Simulate lateral movement and the blast radius starting from any node.
Real-time posture
Measure your posture with a Global Risk Score from 0 to 100, continuously updated and with historical trend.
An always up-to-date inventory, compared with CVEs
A Sentinet³ Infinity agent installed on the host detects software components and versions and helps build the SBOM (Software Bill of Materials). Infinity compares the components with the CVE databases, which are updated periodically, and refreshes the view of the exposures associated with the hosts.
| Stage | Operation | Data produced |
|---|---|---|
| 1. Collection | Lightweight agent installed on the host, with no need to systematically schedule active scans. | Software and version inventory |
| 2. SBOM | Building the record of libraries and components. | SBOM associated with the asset |
| 3. Correlation | Comparison with up-to-date vulnerability sources. | Vulnerabilities and CVEs relating to the components present |
| 4. Contextualisation | Reading CVEs together with topology, exposure and reachability. | Remediation priorities that better reflect the context |
From severity to operational priority
A critical vulnerability is not necessarily the top priority if the asset is isolated, hard to reach or not connected to strategic services. Threat Insight combines the CVSS score with exposure and infrastructure relationships and defines a contextualised remediation priority, distinct from the reference CVSS value.
This makes it possible to tell apart a high-severity but poorly exposed CVE from a less severe vulnerability that lies along a path to a critical system.
Application drill-down and external VA
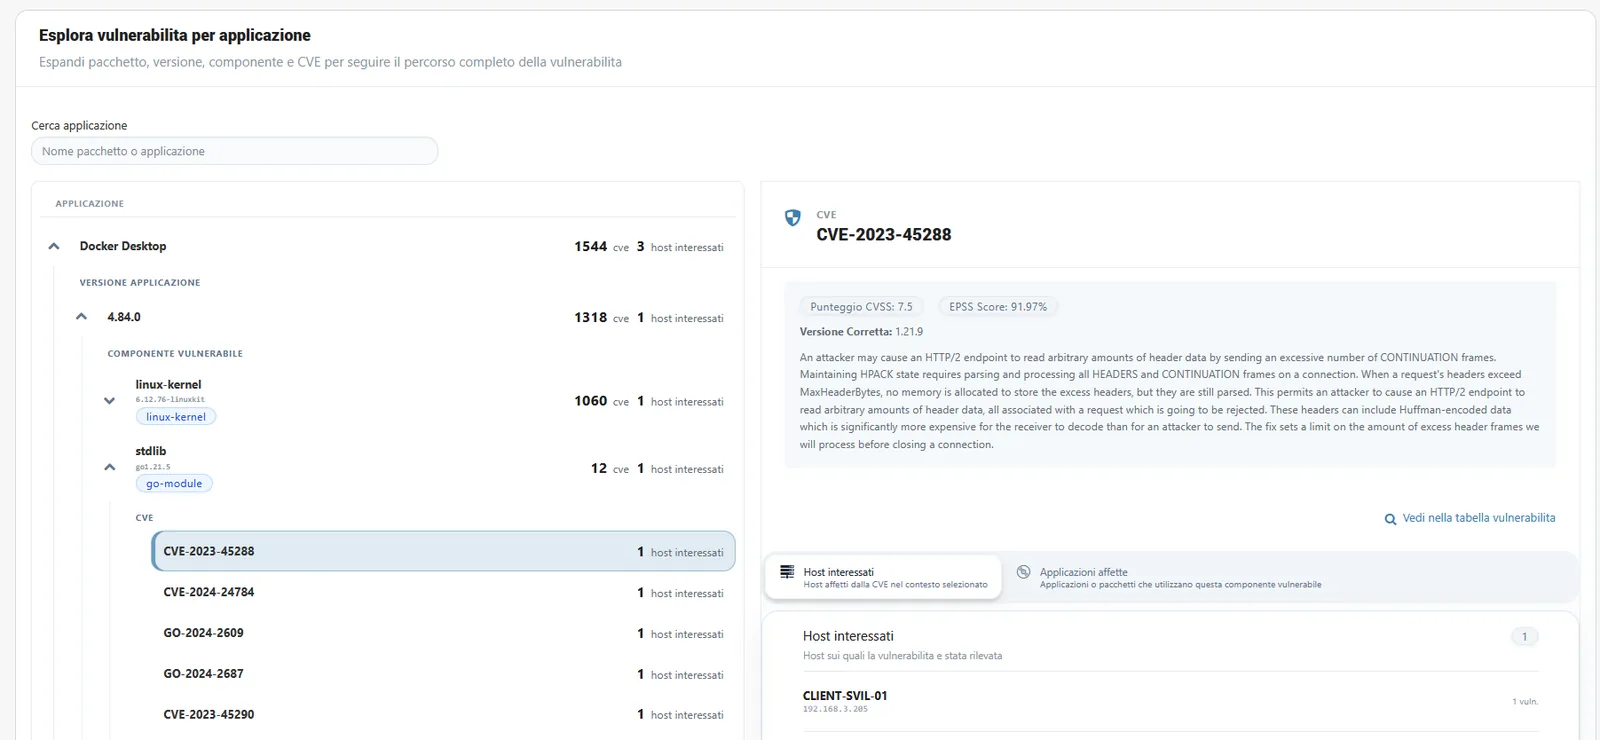
The “application oriented” view searches for vulnerabilities hierarchically: from the detected applications to the libraries they use, down to the related CVEs.
The platform also integrates the results of VA scans run by third-party products, so they can be read centrally together with the other modules.
Compared with periodic-scan VA
| Aspect | Periodic scanning | Sentinet³ approach |
|---|---|---|
| Collection | Snapshot at the time of the scan | Agent-based inventory and continuous vulnerability checking |
| Operations | Scheduling and possible network constraints | No systematic invasive active scanning in the SBOM model |
| Assessment | Severity in isolation, if not contextualised | Severity linked to exposure, topology and assets |
| Integration | Potentially separate results | Correlation with the other modules and with third-party VA |
How far could an attacker get?
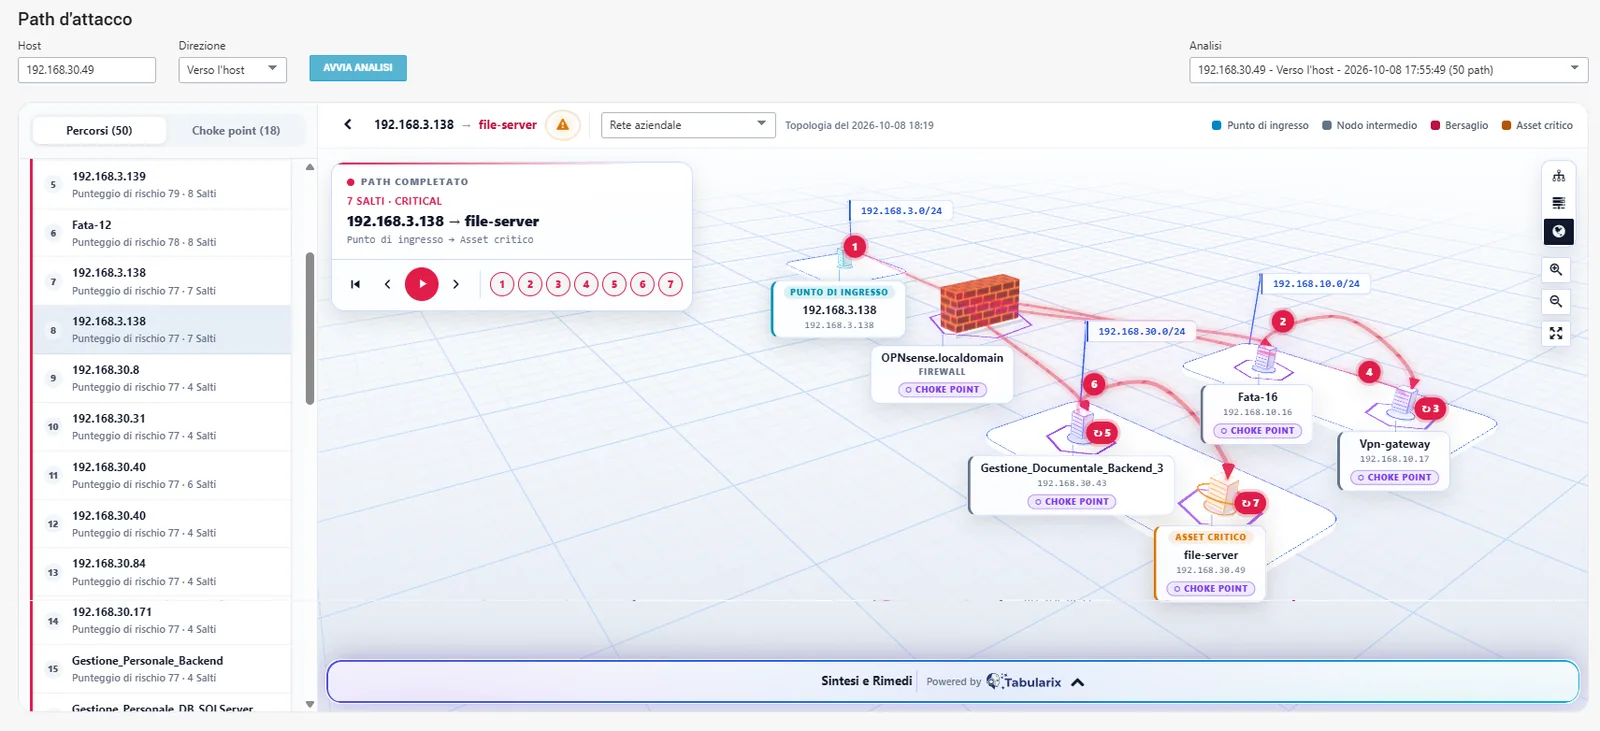
After an initial compromise, how far could an attacker go and which nodes should be protected first? Threat Insight correlates monitoring, network and security data to reconstruct the possible paths towards sensitive systems or priority assets. Multidimensional and three-dimensional representations show the transitions between network segments, the hosts that can be traversed and the points where a defensive measure affects several paths.
Interactive paths, lateral movement and blast radius
On the node graph, the attack path is highlighted step by step, from the outside in. From any node you can simulate lateral movement and assess the blast radius, that is, how far a compromise starting there would reach.
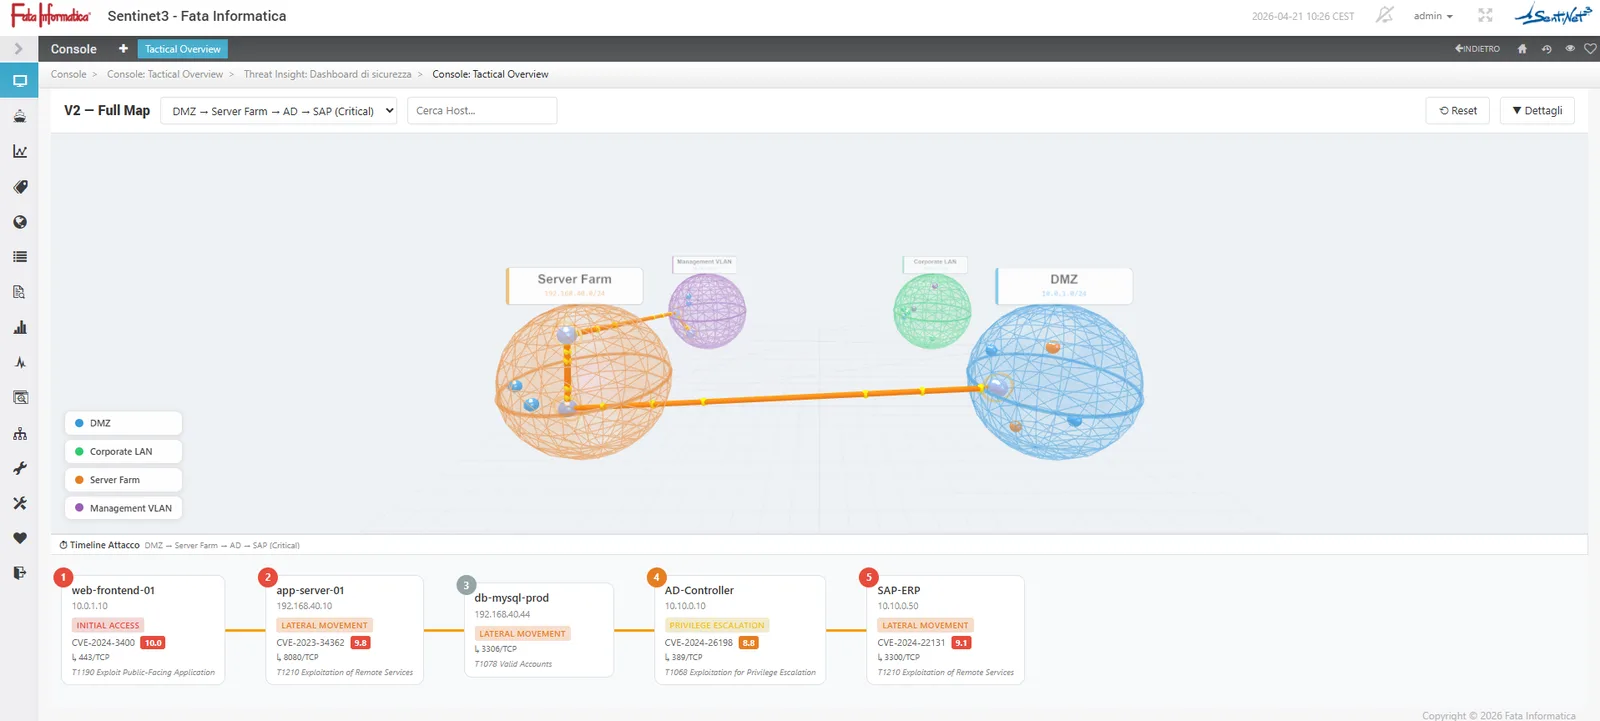
The information behind path analysis
- Network topologies, routers, switches, firewalls, segments and VLANs
- System status, metrics and host classification with tags (function, location, data criticality)
- Real communications observed with NetFlow and Network Insight
- Vulnerabilities and information on software components
- SIEM alerts and correlations between hosts, networks and applications
- Attack surface, sessions and user privileges
- Firewall rules to compare with observed communications
- Shares and shared network resources
- Operating procedures, deployments and any other custom data entered
- Application history and service levels, as additional context
How a path is reconstructed
The engine assigns weights to relationships and produces one or more probable paths, that is, estimates built on the available evidence. Actually observed flows strengthen the model, but do not turn a hypothesised path into a certain prediction of a future attack.
| Step | Method |
|---|---|
| 01. Networks and topology | Starting from the target asset, tracing back and analysing the network context and relationships. |
| 02. Vulnerabilities | Checking the vulnerabilities of the hosts involved in the path segments. |
| 03. NetFlow | Verifying the communications actually observed with the asset and between systems. |
| 04. Chokepoints | Identifying the nodes whose protection can break several compromise chains. |
| 05. Privileges | Analysing what users present on several machines are able to do. |
| 06. Host classifications | Recognising nodes that are sensitive, vulnerable or have broad permissions. |
| 07. Custom processes | Integrating the procedures and business relationships known to operators. |
| 08. Firewalls | Comparing rules, topology and flows to assess reachability. |
| 09. Shares | Contextualising network shares in the propagation hypothesis. |
Towards the “crown jewels”
The analyses identify potential entry points, examine the consequences of an initial compromise, follow lateral movement scenarios and trace paths back from a critical asset (“critical asset backtrack”). This is the view you need when the priority target is, for example, the production database, a domain controller or an essential industrial component.
The analysis does not replace the detection evidence of an incident in progress: it describes possible paths, access conditions and relationships that an adversary could exploit, so that hardening measures can be taken in advance.
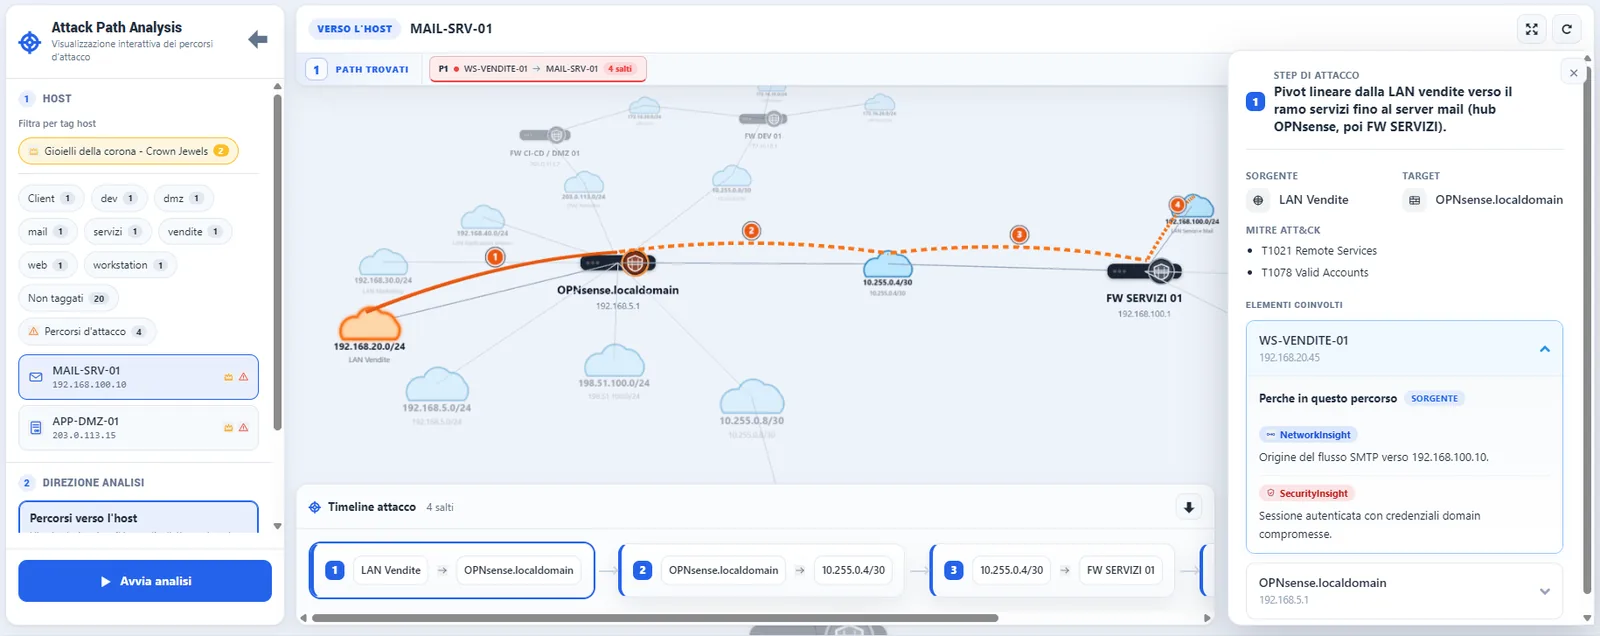
Chokepoints and mitigation strategies
A chokepoint is an element of the network or of the path through which several possible compromise chains pass. Strengthening it, limiting its privileges, fixing its vulnerabilities or reducing its unnecessary connectivity can deliver a greater benefit than indiscriminately patching poorly exposed nodes.
From the CVE list to the action plan. The goal is not only to know which vulnerabilities exist, but which systems, along which paths, threaten the most critical assets, and which remediations deliver the greatest benefit.
Three indices to read risk over time
The risk assessment layer extends the analysis of individual CVEs with context-related indicators: the individual asset, the potential attack paths and the infrastructure as a whole, for comparisons over time and remediation priorities.
| Index | Subject | Information considered |
|---|---|---|
| Asset Risk Index | Individual asset | Vulnerabilities, topological exposure, reachability, host status, importance and relationships. |
| Path Risk Score | Possible attack path | Nodes and steps, access conditions, exposures encountered, potential for lateral movement. |
| Global Risk Score | Overall infrastructure | Summary of the posture and comparison over time of significant exposures. |
Risk Dashboard and impact-based priorities
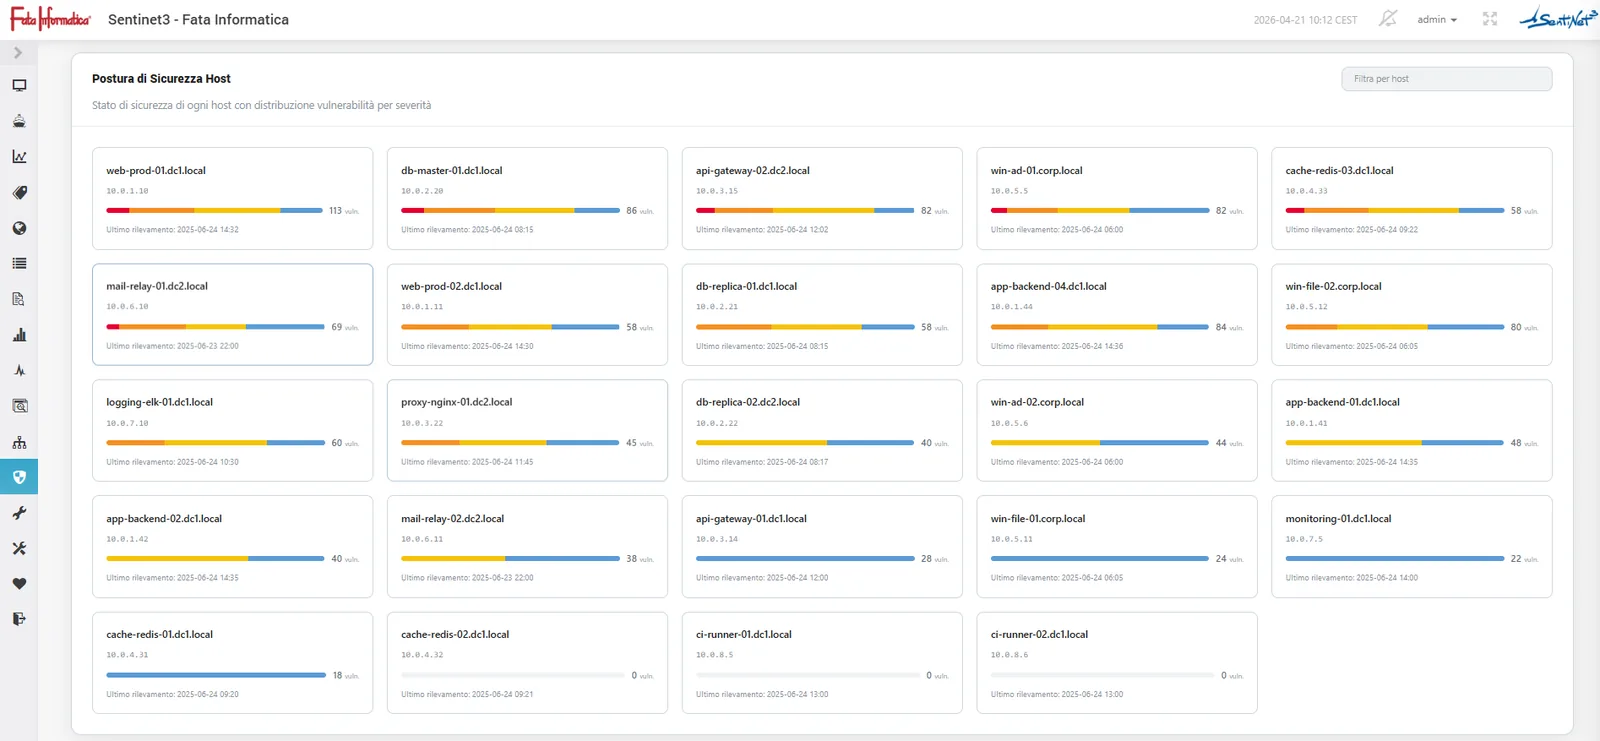
The Risk Dashboard provides a concise reading of the risk of the infrastructure and of the systems that need the most attention, with rankings and charts that complement the operational picture.
Moving from severity alone to an impact-based priority means reading together vulnerabilities, position in the network, actual communications, accessibility, privileges and asset role. Action on chokepoints can break several paths, and the historical series of the indicators show how the situation changes over time.
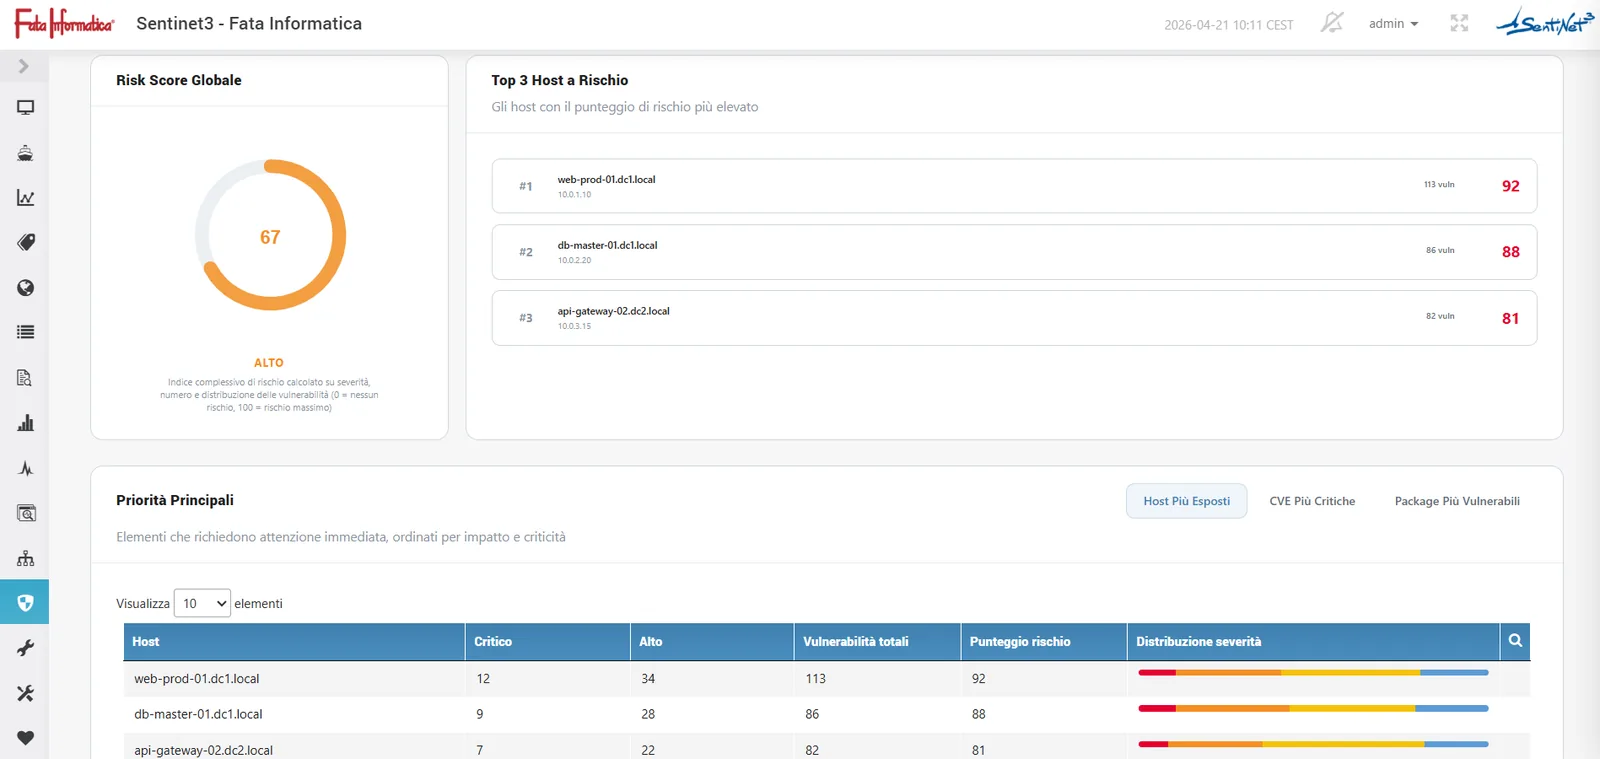
A Global Risk Score from 0 to 100
The Global Risk Score measures the posture on a scale from 0 to 100, is continuously updated and keeps the historical trend. Alongside the risk index, the table of vulnerabilities by host shows which systems to act on.
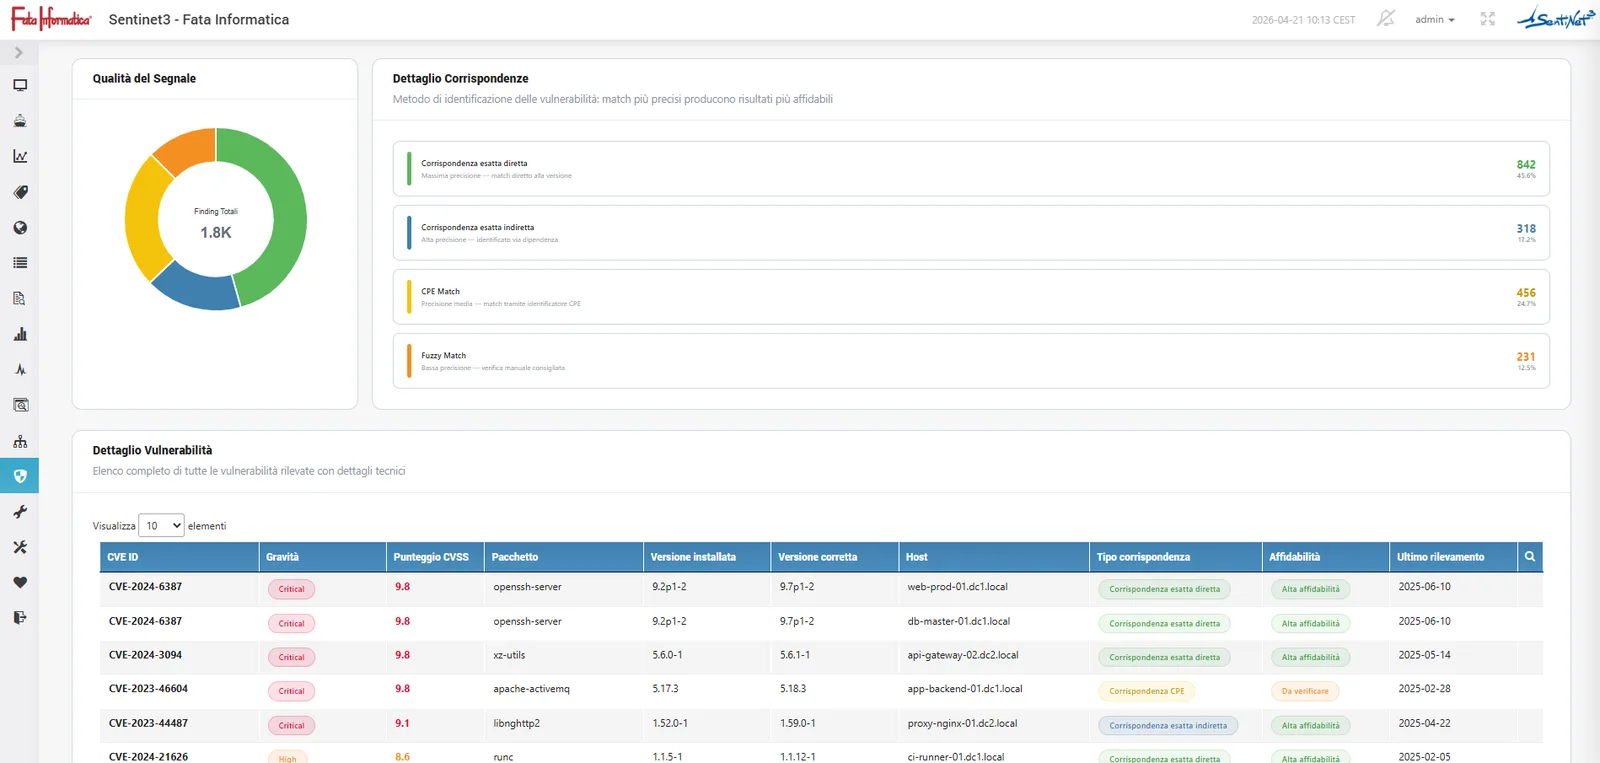
Protecting a critical asset
The priority target is the production database. By backtracking the possible paths, Threat Insight traces back from the systems that could reach it to the entry points, identifies the chokepoints crossed by several chains and indicates the hardening priorities: where to fix vulnerabilities, reduce privileges or limit unnecessary connectivity.
All scenariosRelated topics
Want to see Sentinet³ on your infrastructure?
Tell us about your environment: sites, technologies, critical services. We will show you how Core and Infinity can work on your case.