
Behavioural Learning and Root Cause Analysis
Read how metrics evolve, suggest better-fitting thresholds and correlate events to trace failures back to their cause.
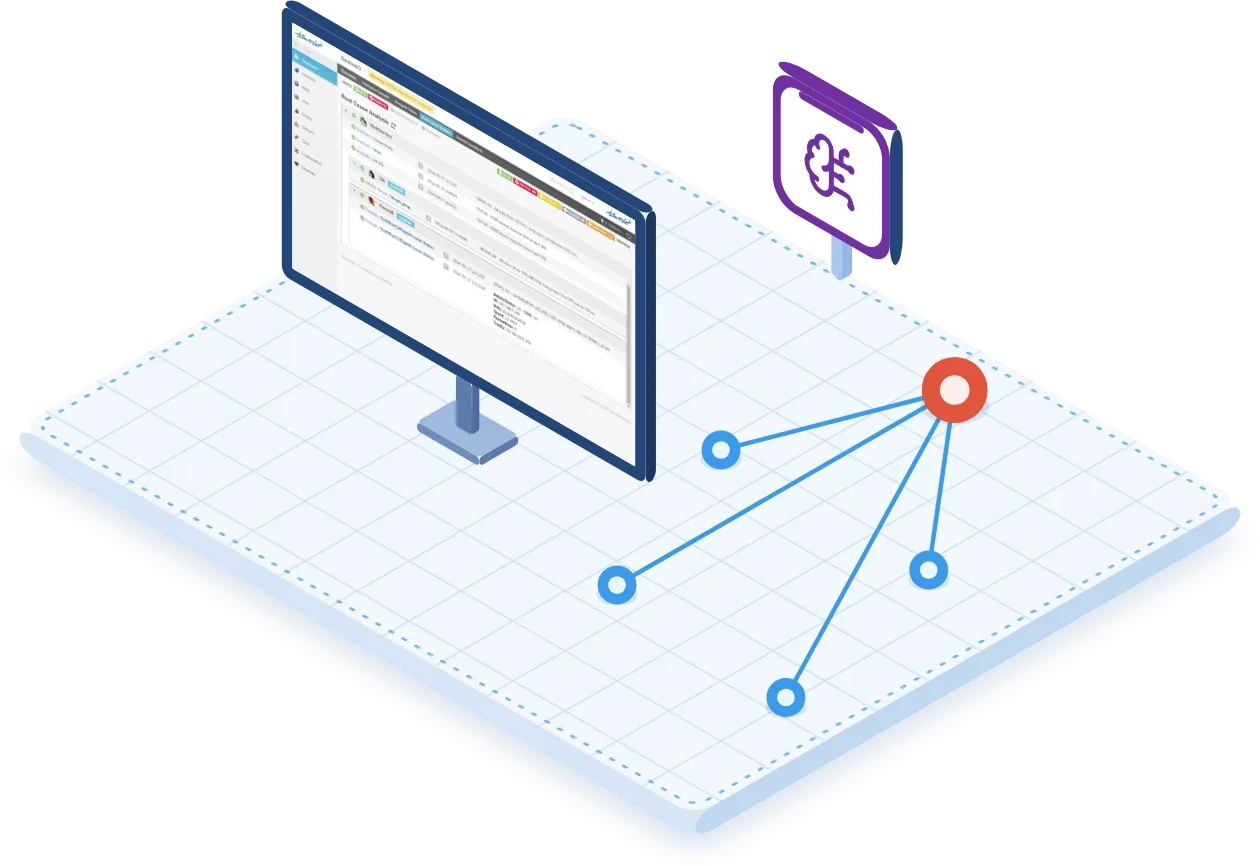
Thresholds that follow the real behaviour of the infrastructure
The Behavioural Learning Engine studies monitoring data and supports operators with suggestions on the thresholds to apply to checks.
Observing trends helps to distinguish recurring conditions from anomalies and to spot hosts or services whose monitoring configuration no longer fits the infrastructure. By relating events to one another, the engine offers three capabilities:
- Behavioral Thresholding: check thresholds suggested by the real behaviour of metrics
- Dependency Model detection: identification of dependencies between components
- Trend Prediction: forecasting of metric trends
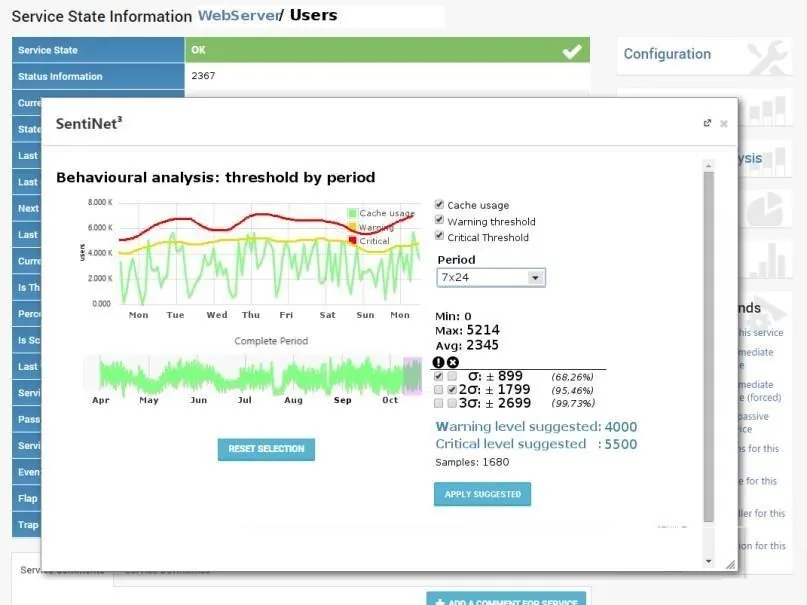
Adaptive baselines
The engine learns the normal behaviour of systems, applications and devices from historical data and builds dynamic baselines that take account of time of day, day of the week, seasonality, typical loads and operating contexts.
Adaptive thresholds
Alarm thresholds adapt automatically to the learned behaviour, reducing false positives in dynamic and complex environments.
Anomalies without static thresholds
Deviations from expected behaviour emerge even without predefined thresholds, including anomalous events not yet formally classified.
Automatic and supervised
The engine works fully automatically, while operators can step in and supervise specific cases.
From individual observations to overall indicators
The ability to aggregate results enables a reading of the entire environment or of its subsets. The information feeds statistical views and Situation Analysis, keeping the link between the individual observation of metrics and the overall indicators.
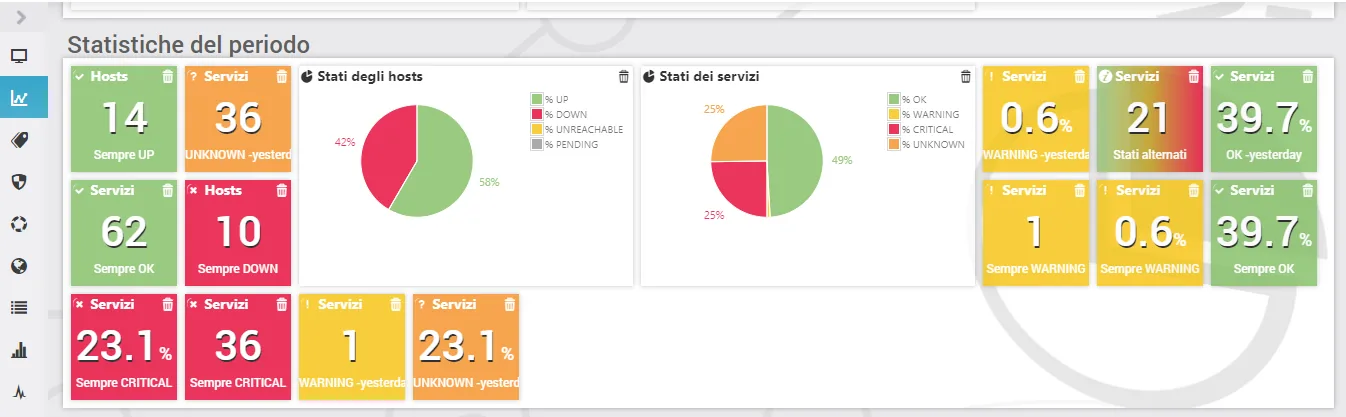
Correlate events to find the root cause
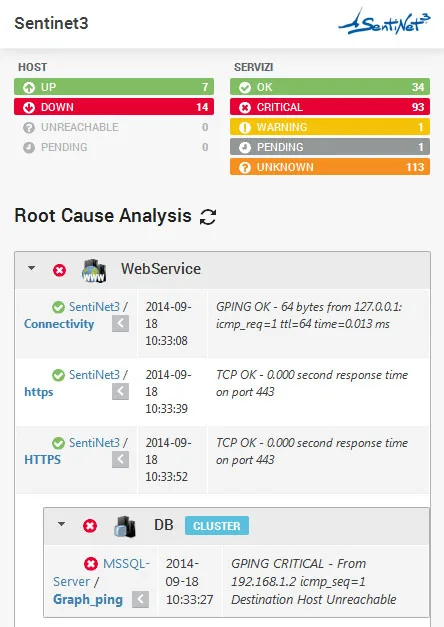
Sentinet³ Root Cause Analysis is an event correlation engine: rules based on AND and OR operators relate multiple events and generate proactive alerts and events. The root cause identified by the correlator can be viewed in the Root Cause Analysis console.
The engine correlates events from heterogeneous sources (network, hosts, applications, security and environment) and identifies cause-and-effect relationships between active alarms, degraded metrics and behavioural changes. It detects the primary cause of a malfunction in real time, telling it apart from secondary effects and symptoms: the visual representation of dependencies reduces mean time to detect (MTTD) and mean time to repair (MTTR).
Diagnosis is not limited to the number of alerts generated: a device shared by several services can explain multiple simultaneous alarms, while the hierarchical view helps to tell symptoms apart from the origin of the outage.
- Several events appear within the same interval.
- AND/OR rules correlate them with states and relationships between systems.
- The correlation generates a proactive alert or event and highlights the common element, for example a device on which several services depend.
- In the Root Cause Analysis console, troubleshooting focuses on the systems responsible.
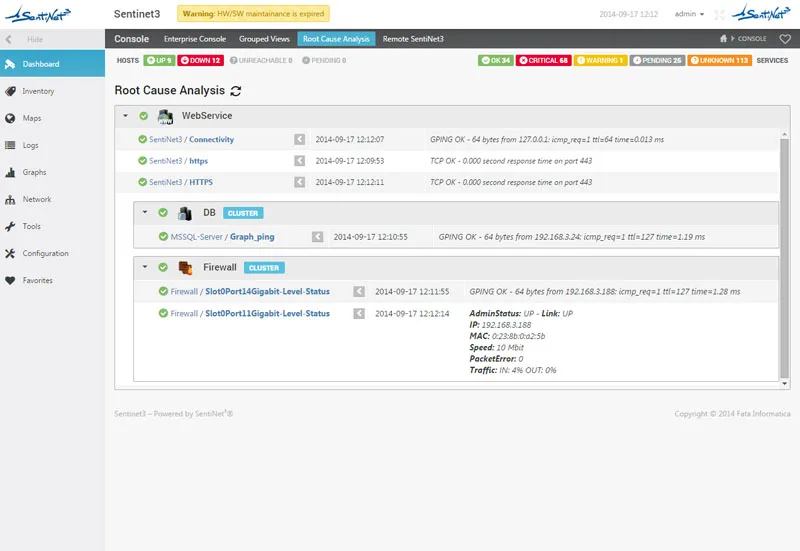
The root cause of an application service
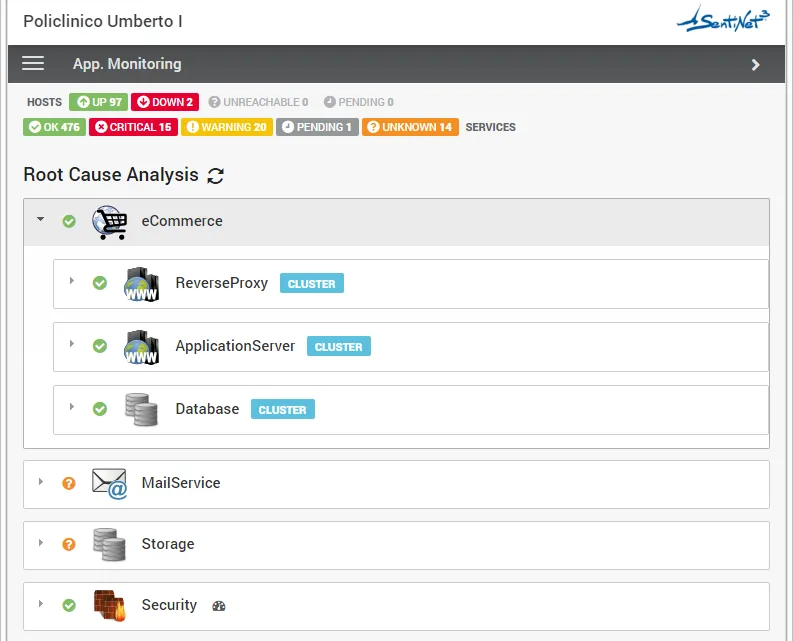
The same analysis applies to services made up of several components: for an eCommerce service the console shows the status of the reverse proxy, application server, database, mail service, storage and security, to understand which component caused the problem.
Two complementary functions in day-to-day management
Behavioural Learning
Helps configure more useful and stable checks.
Correlation and Root Cause Analysis
Correlates events and focuses troubleshooting on the systems responsible.
The operator remains in charge. In both cases the final assessment depends on the infrastructure and on the information available.
Multi-site connectivity failure
Several services at one site become unavailable within the same interval. The topology view, interface checks and geo-referenced maps help tell the failure of a shared device apart from the unavailability of individual systems.
All scenariosRelated topics
Want to see Sentinet³ on your infrastructure?
Tell us about your environment: sites, technologies, critical services. We will show you how Core and Infinity can work on your case.