
Applications and services
Application checks to ensure service availability and responsiveness.

The components that services run on
The Core offers checks on application servers such as Tomcat, WebSphere, WebLogic and JBoss; on Microsoft Exchange, SharePoint, Project Server, SQL Server and IIS environments; and on Oracle, Microsoft SQL Server, MySQL and MariaDB, DB2 and PostgreSQL databases.
Monitoring can cover service response, accessibility, processes, resource usage, connectivity and specific indicators available through plug-ins and dedicated checks.
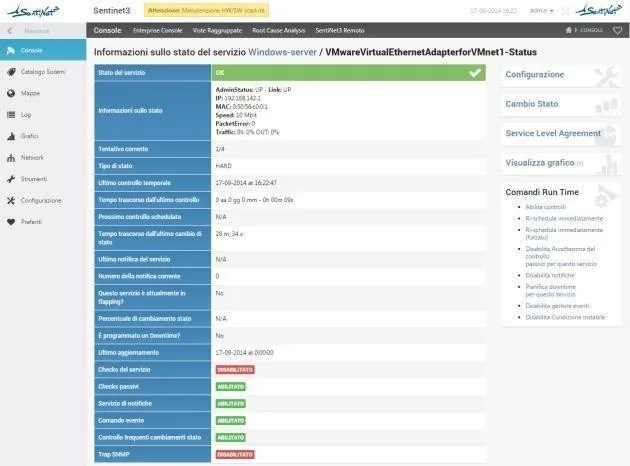
Families of environments that can be monitored
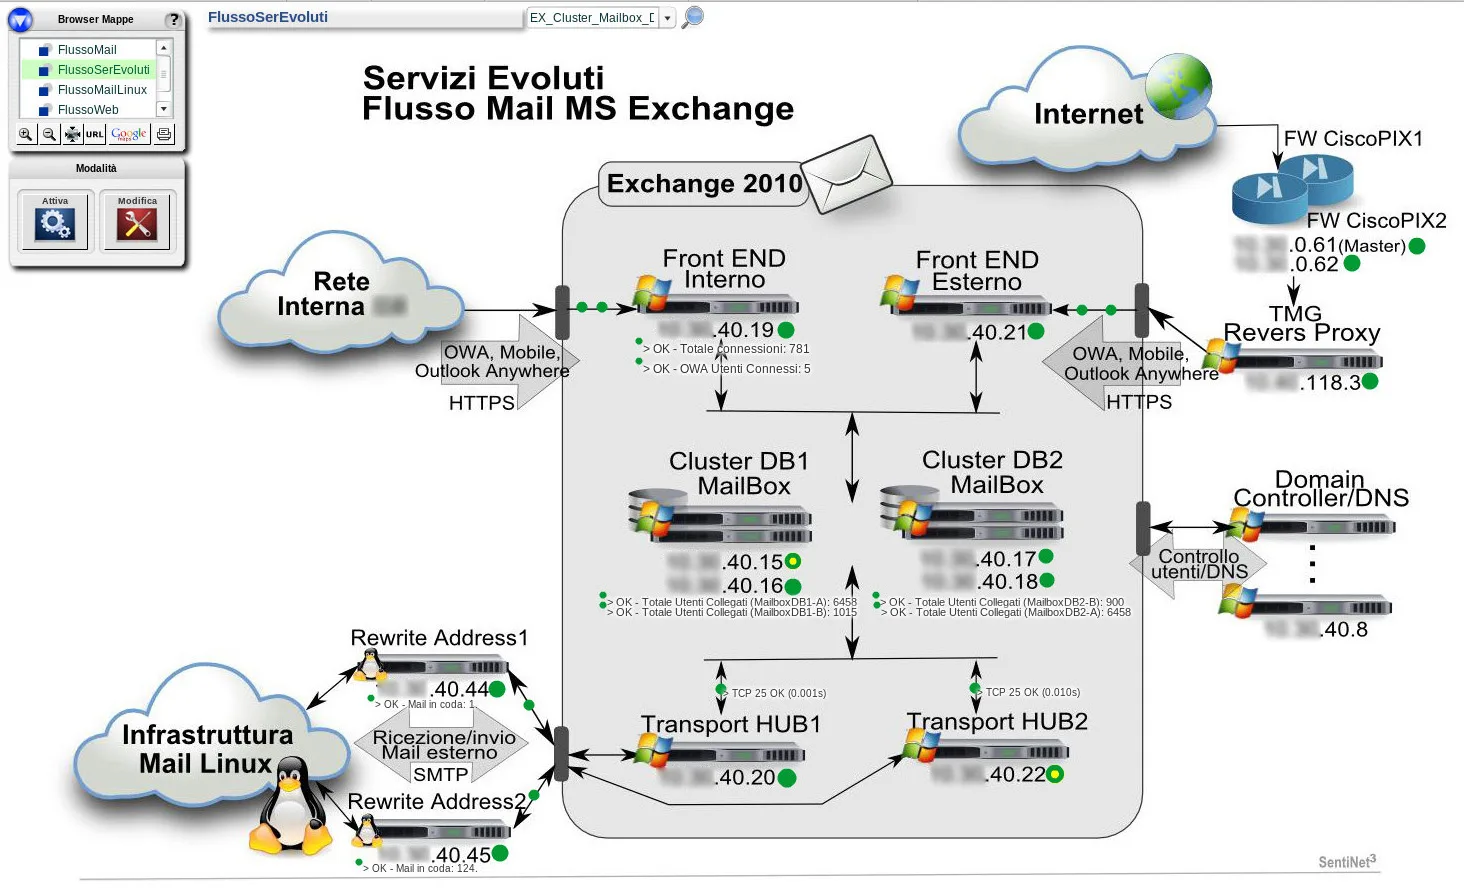
Linux and Unix
- Red Hat Enterprise Linux
- SUSE Linux Enterprise
- Debian
- Ubuntu Server
- CentOS
- Rocky Linux
- Oracle Linux
- Solaris
- IBM AIX
- HP-UX
- FreeBSD
Windows and Microsoft environments
- Windows Server
- Active Directory
- Exchange
- SharePoint
- SQL Server
- IIS
- Microsoft .NET
- Hyper-V
- DFS and file servers
- Windows event log
Virtualised and cloud environments
- VMware vSphere and vCenter
- VMware ESX
- Microsoft Hyper-V
- Citrix Hypervisor
- Xen
- KVM
- Proxmox VE
- Nutanix AHV
- Docker
- Kubernetes
- Microsoft Azure
- Amazon Web Services
Application servers
- Apache Tomcat
- IBM WebSphere
- Oracle WebLogic
- JBoss
- WildFly
- GlassFish and Payara
- Jetty
- Java VM via JMX
- Node.js
- SAP NetWeaver
Web servers and web services
- Apache HTTP Server
- Microsoft IIS
- Nginx
- LiteSpeed
- HAProxy
- Varnish
- Reverse proxy
- REST and SOAP web services
- Website and portal response times
Databases
- Oracle Database
- Oracle RAC
- Microsoft SQL Server
- MySQL
- MariaDB
- IBM DB2
- PostgreSQL
- SAP HANA
- MongoDB
- Redis
- Queries via ODBC and JDBC
Network and perimeter security
- Cisco
- Juniper
- HPE Aruba
- Huawei
- F5 BIG-IP
- Fortinet FortiGate
- Palo Alto Networks
- Check Point
- WAN and MPLS links
- Wireless controllers and access points
Email, middleware and services
- Exchange and Exchange Online
- Postfix
- Zimbra
- HCL Domino
- IBM MQ
- RabbitMQ
- Apache Kafka
- DNS and DHCP
- LDAP and RADIUS
- SSL/TLS certificates
Data center, environment and OT
- UPS
- PDUs and power consumption
- Temperature and humidity
- Flooding and smoke
- Air conditioning and CRAC
- Door contacts and rack access
- Storage and SAN
- Modbus
- OPC and SCADA
More than a port that answers
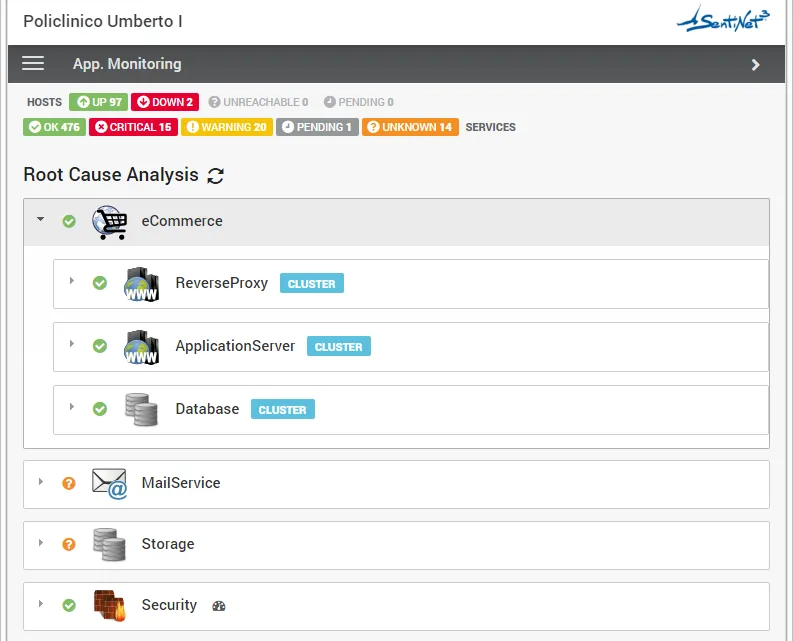
Beyond the simple response of a port, the platform checks HTTP services and measures web application performance, including through simulated end-to-end transactions, to confirm that an application is working correctly. Checks therefore reflect service conditions that are more meaningful than a ping or a running process.
From the resource to the application condition
When a service degrades, the operator traces back to the system checks that support it: CPU, memory, storage, network and the application process. Operational correlation comes from having checks and infrastructure relationships available together, and does not require the application to be described with distributed tracing APM tools.
- The HTTP check or web transaction reports that the service has degraded.
- The operator opens the system checks of the host it runs on: CPU, memory, storage.
- They check the network and the application process to identify the resource responsible.
Need APM? The application monitoring described on this page is that of the Core. OpenTelemetry-based Application Performance Monitoring, End User Experience and Business Monitoring belong to Application Insight, the dedicated Infinity module. Discover Application Insight
Response times, queues and queries under observation
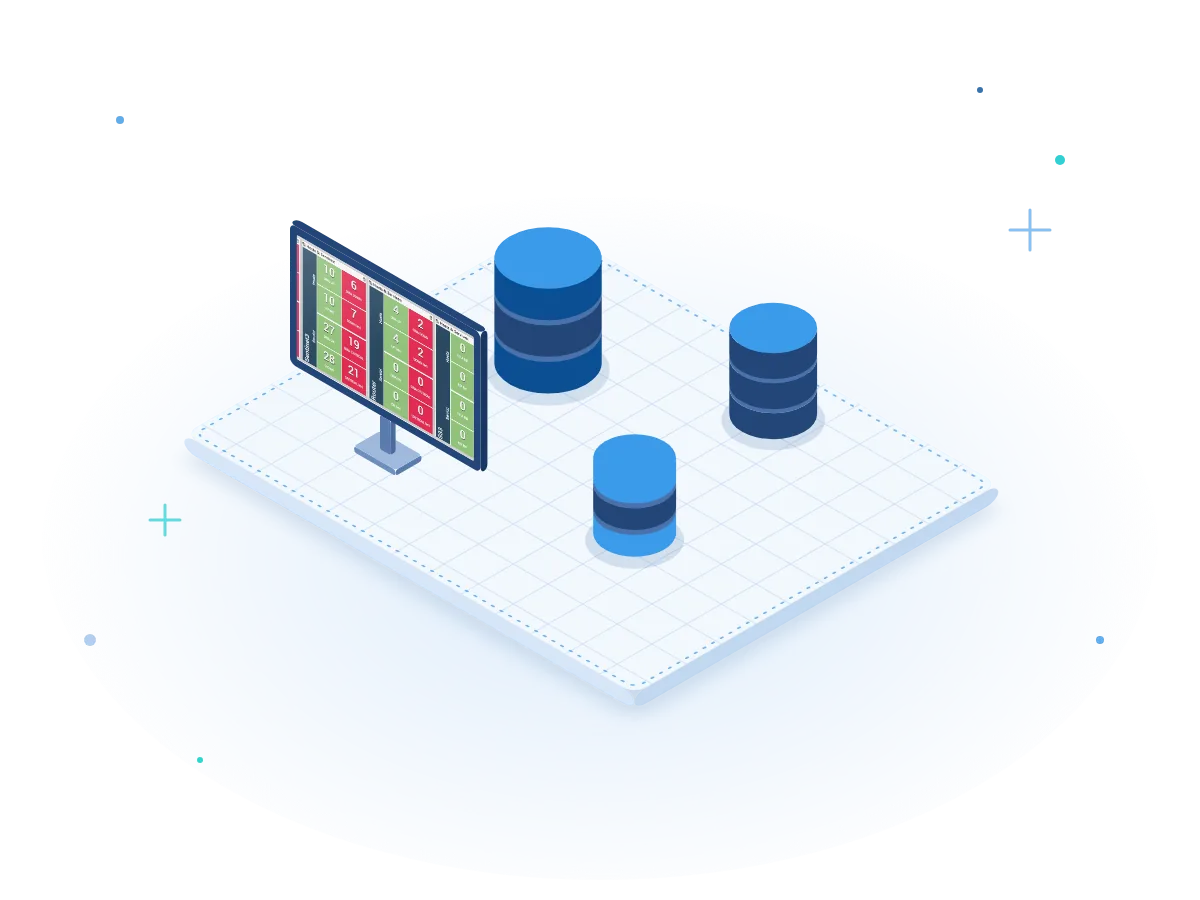
The Core analyses application services and processes: response times, resource usage per individual process, application latencies and queues, and dependencies between components, such as parent-child calls.
On relational databases it constantly checks availability, load and performance, down to individual queries and critical tables.
- Oracle
- PostgreSQL
- MySQL and MariaDB
- Microsoft SQL Server
- IBM DB2
| Area | What is measured |
|---|---|
| Services and processes | Response times and resource usage per individual process. |
| Latencies and queues | Application latencies and queues of the monitored services. |
| Dependencies | Relationships between application components, such as parent-child calls. |
| Web applications | Performance measured with simulated end-to-end transactions. |
| Databases | Availability, load, query response times, resource usage, locks, deadlocks and critical tables. |
Technologies with a dedicated Pattern
For each one, the Pattern of preconfigured checks and the full list of parameters.

Web server
Application server
Microsoft technologies
Gradual saturation of a service
A mail service keeps responding, but the free disk space decreases steadily. The Core detects that thresholds have been exceeded, sends a notification to the people responsible and can trigger a pre-authorised automated mitigation procedure.
All scenariosRelated topics
Want to see Sentinet³ on your infrastructure?
Tell us about your environment: sites, technologies, critical services. We will show you how Core and Infinity can work on your case.