
Network Monitoring
From devices to interfaces: network availability, performance and anomalies.
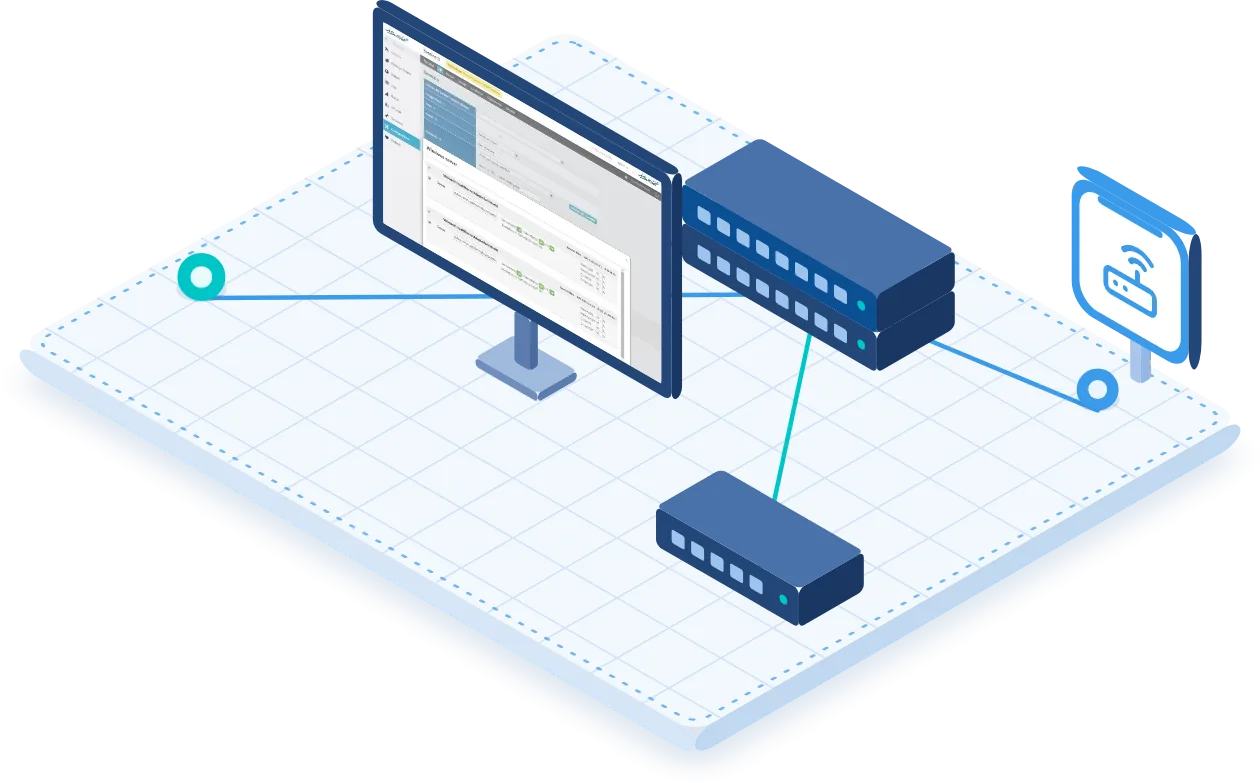
Devices, ports and connectivity under control
The Core monitors firewalls, switches, routers, load balancers and other network devices, checking their reachability, state, flows, configurations, updates, throughput capacity and NAT, as well as port and VLAN state, interface utilisation, errors, response times and the operating conditions exposed by the monitoring protocols.
Reading bandwidth and latency metrics makes it possible to identify bottlenecks and connectivity degradation.
- Routers
- Switches
- Firewalls
- Load balancers
- NAT
- Ports and VLANs
- Bandwidth
- Latency
- Errors
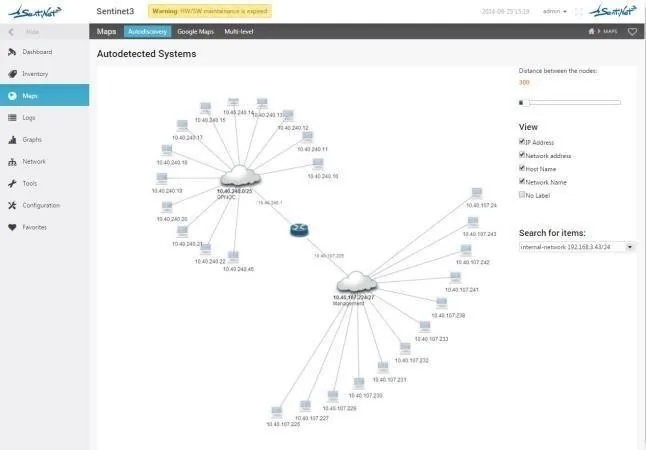
All the interfaces of a device, in a few steps
Interface Inspector identifies the interfaces of a device and brings them under monitoring. It simplifies the selection of the ports to check, with traffic, state and performance metrics for each interface, without having to define all the checks manually from the outset.
- Identification of the device’s interfaces.
- Selection of the ports to keep under control.
- Traffic, state and performance metrics for each interface.
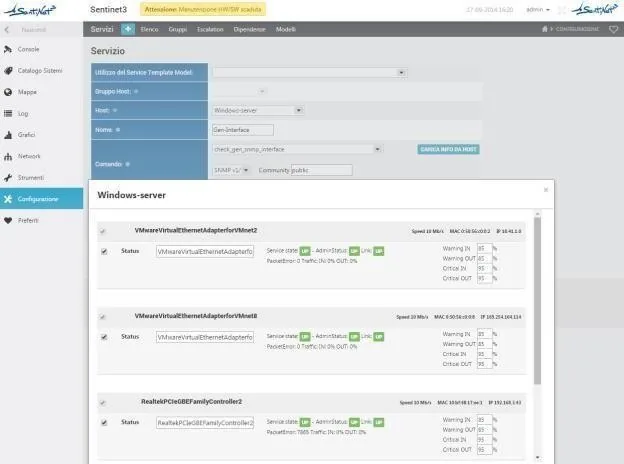
Querying devices and listening to their notifications
| Check | What it provides |
|---|---|
| SNMP polling | Reading the state and metrics of devices. |
| SNMP traps and other events | Receiving notifications originated by the devices. |
| TCP and UDP ports | Checking ports and the services associated with them. |
| Interface analysis | Inbound and outbound traffic with charts, peaks, minimums, maximums and averages. |
| Network services | Checks on DNS, DHCP, SMTP, NTP, RADIUS and Active Directory services. |
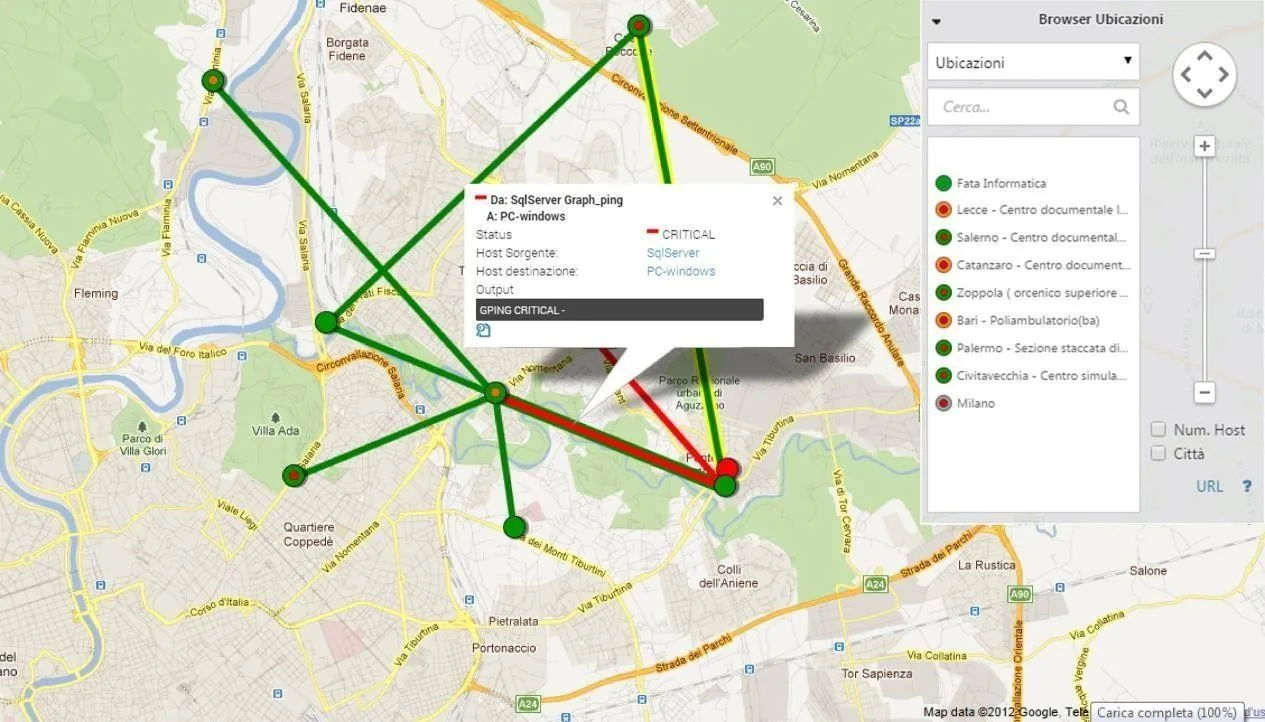
| Links between sites | Availability and performance shown on the maps. |
Who generates traffic, and with which protocols
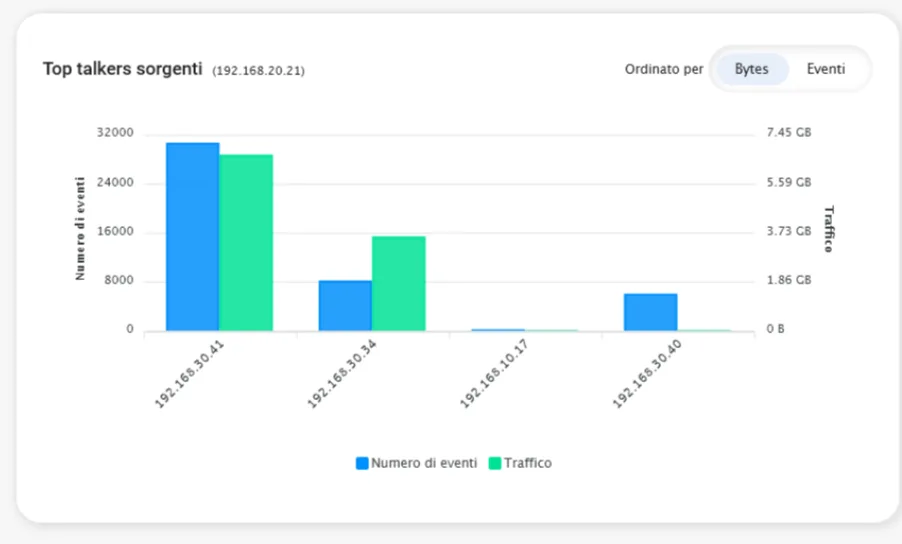
Alongside active and passive checks via SNMP, WMI, SSH and Syslog, the Core acquires NetFlow data from the devices and displays traffic metrics in real time: top talkers, dominant protocols and anomalies.
- Real-time traffic metrics
- Top talkers and dominant protocols
- Traffic anomalies highlighted
Need extended analysis of conversations? Searches and comparisons on NetFlow, sFlow and IPFIX flows, the communication graph and dedicated checks fall within the scope of Network Insight. Discover Network Insight
Devices with a dedicated Pattern
For each one, the Pattern of preconfigured checks and the full list of parameters.

Network
Multi-site connectivity failure
Several services at one site become unavailable in the same interval. The topology view, interface checks and georeferenced maps help to distinguish the failure of a shared device from outages of individual systems. Escalation routes the event to the group responsible for connectivity.
All scenariosRelated topics
Want to see Sentinet³ on your infrastructure?
Tell us about your environment: sites, technologies, critical services. We will show you how Core and Infinity can work on your case.