
Infrastructure and systems
Continuous checking of the availability, state and performance of computing resources.
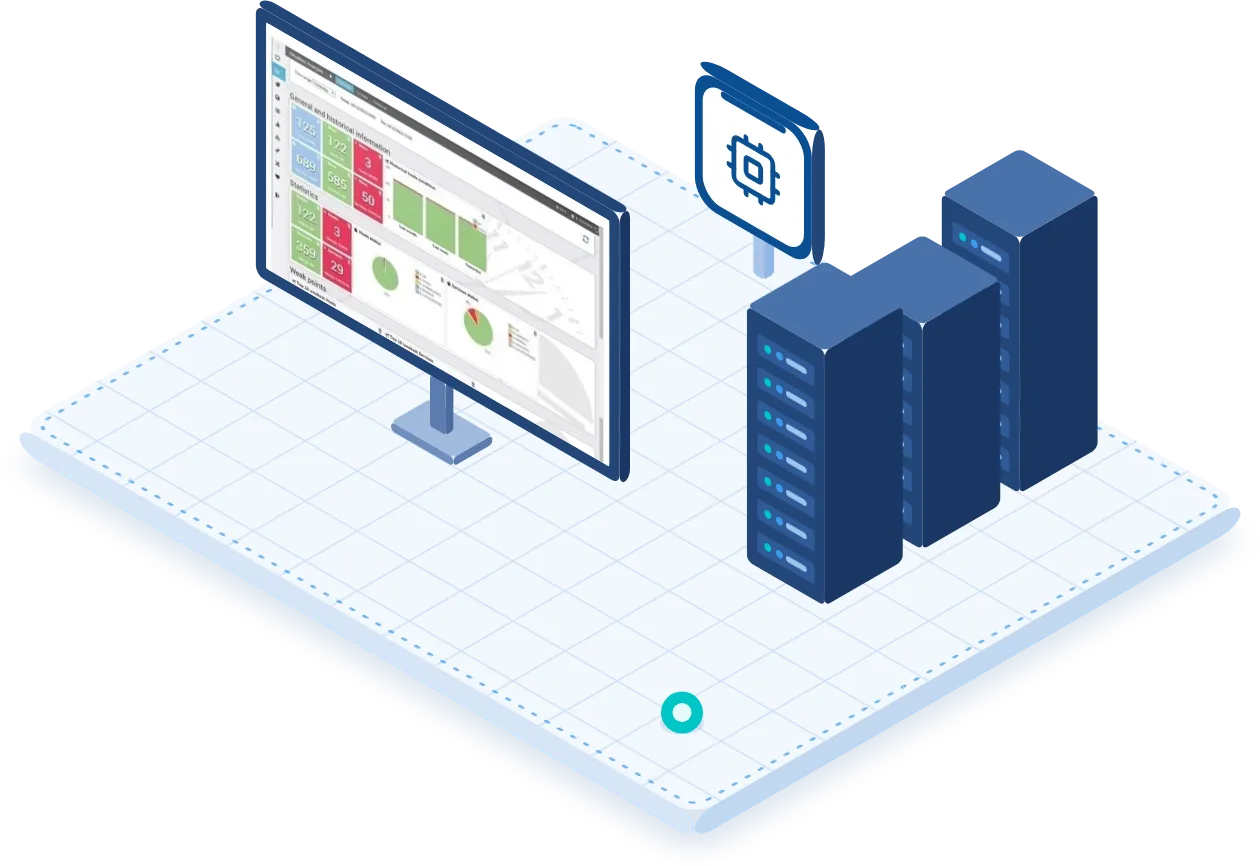
Every host, with the right protocol
The Core monitors Windows and Linux hosts and various Unix and enterprise platforms, including Solaris, HP-UX, AIX and AS/400. Checks cover CPU, memory, swap, system load, disk space and activity, processes, system services, availability and the hardware parameters exposed by the devices.
Using different protocols makes it possible to adapt each check to the technology being monitored.
- CPU
- Memory and swap
- Load
- Disks
- Processes
- System services
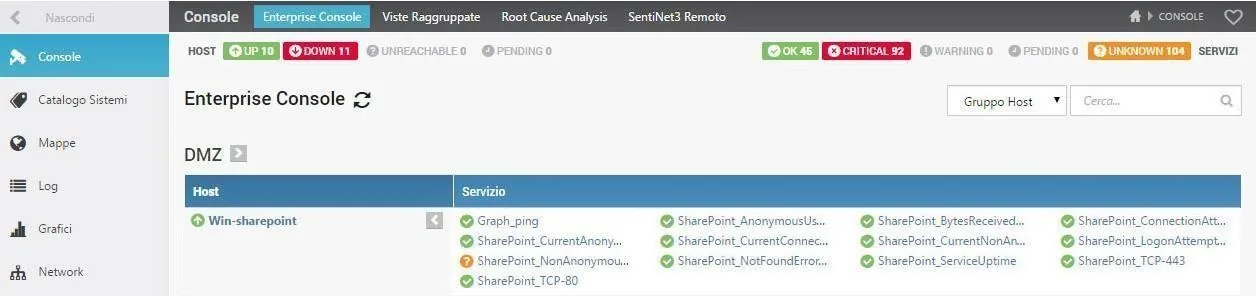
From the hardware to the services that depend on it
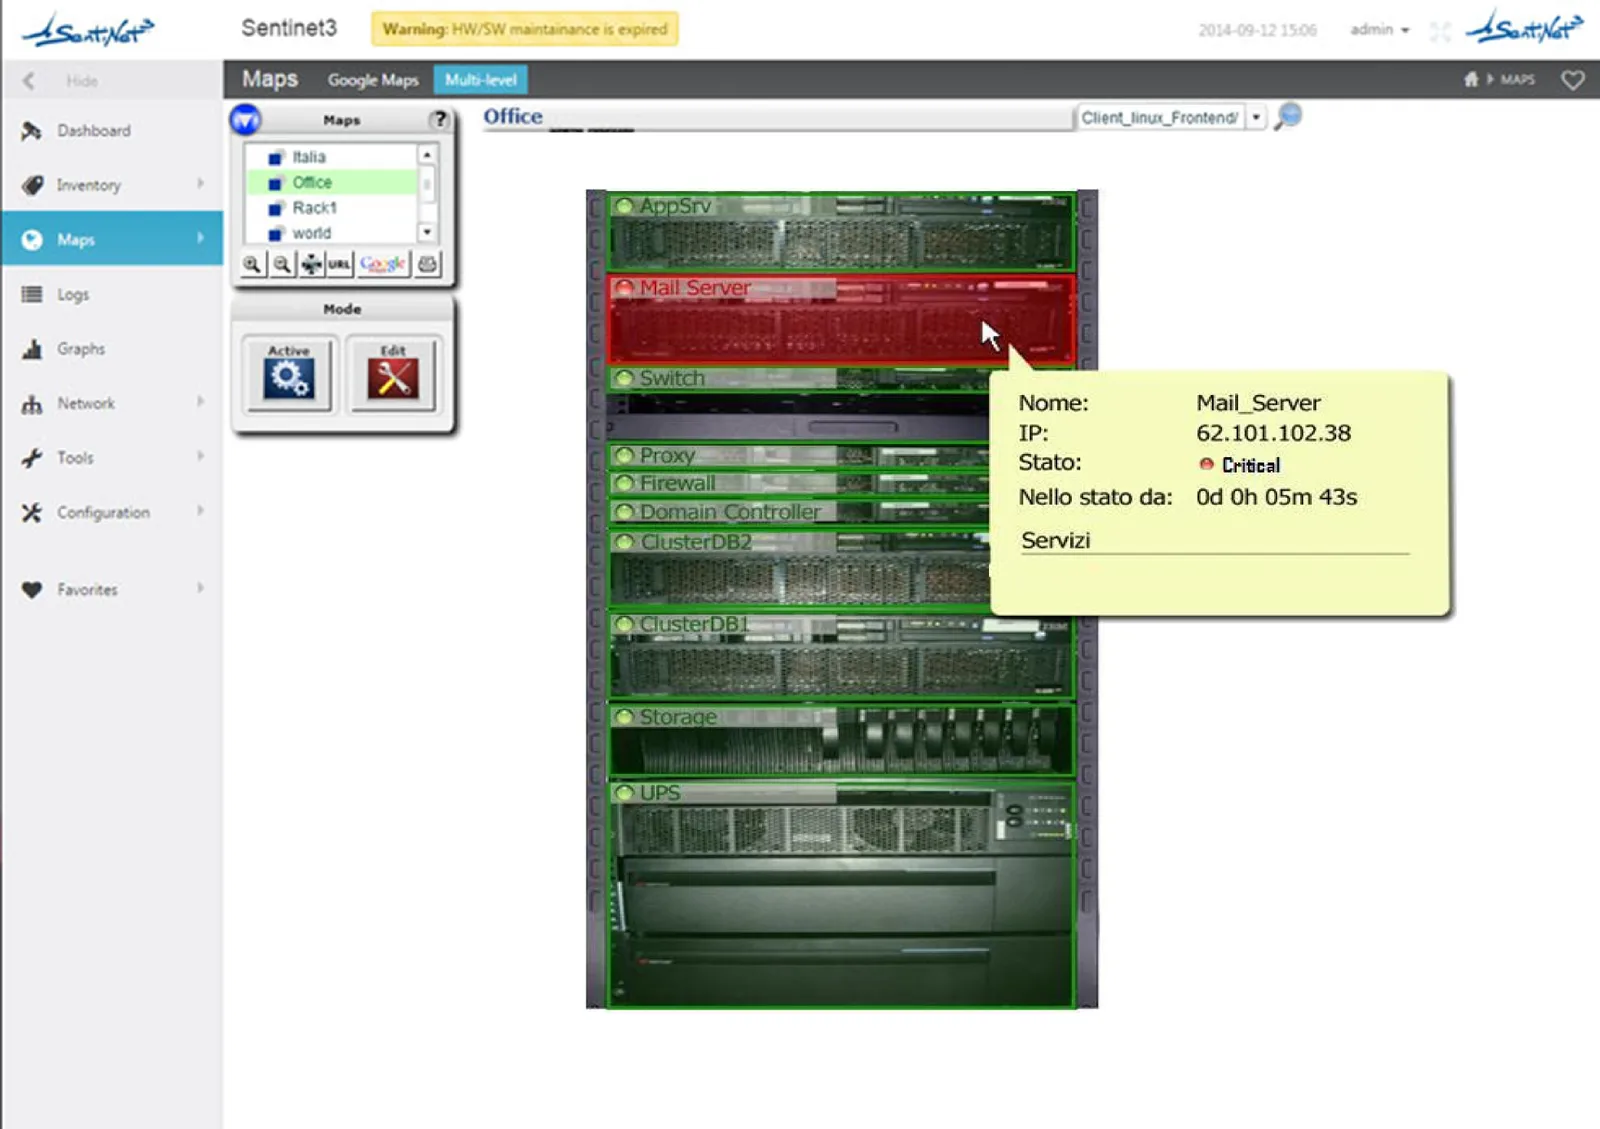
Hardware and physical devices
State of physical servers and disks, with RAID controllers and SMART, and of critical parameters: temperatures, fans, power supplies and sensors.
Storage and SAN
Storage devices and SAN networks: fibre connectivity, disk latency, throughput and IOPS.
Virtualisation
VMware, KVM, Xen and Hyper-V hypervisors with visibility of hosts and guests: allocated resources, CPU, RAM and storage usage, VM state, per individual machine or in summary views.
Containers
Docker and LXC containerised environments, natively supported by Core cross-platform monitoring.
UPS and power systems
Power parameters, charge and discharge state and alarms on batteries, short circuits and outages.
Essential services
Active Directory and the DNS, DHCP, SMTP, RADIUS and NTP infrastructure services, plus other services relevant to business continuity.
System and service together. A change of state can be associated both with the system that hosts it and with the service that depends on it.
Telling a sudden failure from a gradual degradation
Analysing history, charts and thresholds makes it possible to separate sudden outages from gradual degradation. Growing memory consumption, a disk close to saturation or a service that stops responding become evidence that can be consulted and managed before the problem causes a prolonged interruption.
For thresholds that better match the real behaviour of metrics, the Behavioural Learning Engine suggests the values to apply to the checks.
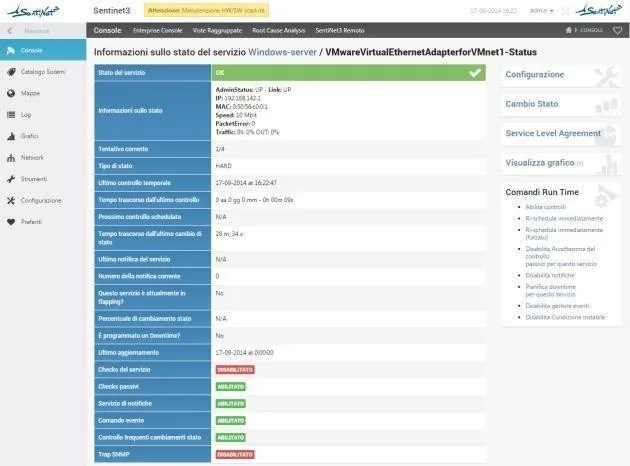
Technologies with a dedicated Pattern
For each one, the Pattern of preconfigured checks and the full list of parameters.

Virtualisation
Microsoft technologies
Environment
Gradual saturation of a service
A mail service keeps responding, but the free disk space decreases steadily. The Core detects that thresholds have been exceeded, sends a notification to the people responsible and can trigger a pre-authorised automated mitigation procedure. The operator consults history and charts to establish the urgency and prevent an interruption.
All scenariosRelated topics
Want to see Sentinet³ on your infrastructure?
Tell us about your environment: sites, technologies, critical services. We will show you how Core and Infinity can work on your case.